Free fishbone diagram template
A fishbone diagram template
with room for every cause.
Put the problem in the centre. Sort possible causes under people, methods, machines, materials, measurements and environment. Then check them one by one.
Use it free — no card, no trial →
- Free forever — not a trial
- Up to 10 maps, kept for good
- Every export included
Free has no end date — upgrade only if you outgrow 10 maps. Opens with the six cause groups and a branch for the most likely causes.
Six groups, no blind spots. The 6 Ms make you look past the first cause someone names.
Rate and check each cause. Every cause has a likelihood, an evidence note and a status: suspected, confirmed or ruled out.
Shortlist what matters. Pull the likely causes into one branch. Export it as a PDF, an image or slides for the review.
How to make a fishbone diagram, step by step
The fishbone is also called an Ishikawa or cause-and-effect diagram. Kaoru Ishikawa, a Japanese quality expert, made it popular in the 1960s. The problem is the fish's head. The cause groups are its bones. This template holds the same content as a map: the problem in the centre, the groups as branches.
- State the effect. Write the problem as a fact you can measure. "Dense loaves in week 22", not "bread is bad". It is the map's centre.
- Pick the cause groups. Factories use the 6 Ms: people, methods, machines, materials, measurements, environment. Service teams often swap in policies, place or suppliers. Rename the branches to fit.
- Brainstorm causes. Ask "what could cause this?" under each group. Write every idea as its own topic. Do not judge yet.
- Go one level deeper. Ask why of each cause. Add the answers as child topics. Stop when you reach something you can check.
- Rate and check. Give each cause a likelihood. Then look at data, logs or the process itself. Mark it confirmed or ruled out, and note the evidence.
- Shortlist and act. Move the two or three confirmed causes into the most likely branch. Run a 5 whys on each, then decide the fix.
Worked example: dense sourdough
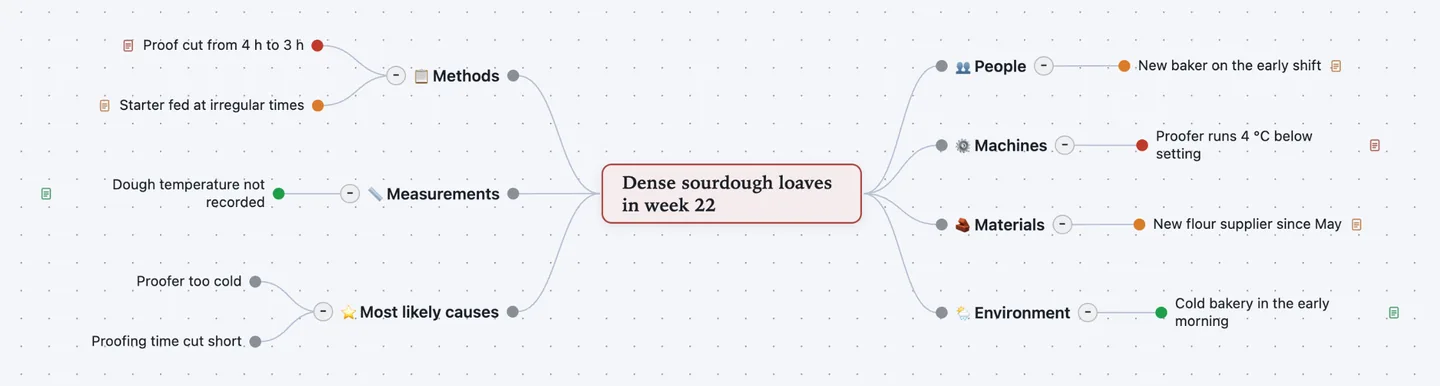
A small bakery gets complaints about dense loaves. The team sorts every idea under the six groups, rates it, and checks it. This is the map shown above.
- 👥 People
- New baker on the early shiftLikelihood: Medium · Verified: Ruled out · Evidence: Dense loaves on her days off too
- 📋 Methods
- Proof cut from 4 h to 3 hLikelihood: High · Verified: Confirmed · Evidence: Shift log, 6 of 7 days
- Starter fed at irregular timesLikelihood: Medium · Verified: Suspected
- ⚙️ Machines
- Proofer runs 4 °C below settingLikelihood: High · Verified: Confirmed · Evidence: Probe thermometer vs display
- 🧱 Materials
- New flour supplier since MayLikelihood: Medium · Verified: Suspected
- 📏 Measurements
- Dough temperature not recordedLikelihood: Low · Verified: Confirmed
- 🌦️ Environment
- Cold bakery in the early morningLikelihood: Low · Verified: Ruled out · Evidence: Room at 21 °C at 5 am
- ⭐ Most likely causes
- Proofer too cold
- Proofing time cut short
The two confirmed causes work together: a cold proofer needs more time, not less. The missing dough temperature log explains why nobody saw it. The ruled-out causes stay on the map with their evidence.
Let ChatGPT or Claude draft it
Connect Atlas Red to ChatGPT or Claude once. It is free. Then ask:
Make a fishbone diagram in Atlas Red for this problem: [describe the effect]. Use the fishbone template, list at least two causes under each of the six groups, and rate each cause's likelihood.
You get the same template, filled in, in your own account. Fix what it got wrong by hand. Or ask for another round.
Questions people ask
What is a fishbone diagram?
A chart of the possible causes of one problem. The problem is the head. The causes sit on bones, grouped by type. It is also called an Ishikawa diagram, after Kaoru Ishikawa, or a cause-and-effect diagram. Quality, operations and healthcare teams use it to plan a root cause analysis.
What are the 6 Ms in a fishbone diagram template?
Man (people), method, machine, material, measurement and mother nature (environment). They are the usual cause groups in manufacturing. Service teams often use other groups, such as policies, procedures, people and place. In this template you rename a branch to change a group.
Does this fishbone diagram template draw the fish shape?
No. It holds the same content as a map: the problem in the centre, the cause groups as branches, the causes under them. You lose the fish picture. You gain room: long cause names fit, and each cause can branch again.
Is this fishbone diagram template free?
Yes. It is part of Atlas Red's Free edition: up to 10 maps, kept with no end date, every export included, no credit card. Pro is a one-time $99 payment for unlimited maps.
Can I export the fishbone diagram to PowerPoint or Word?
Not as a .pptx or .docx file. Every edition exports PDF, PNG, JPEG and SVG images, slides, an interactive web page, Markdown, OPML and plain text. Markdown keeps fields as "Label: value" lines and pastes into Word or Google Docs.
Can ChatGPT or Claude make a fishbone diagram for me?
They can draft one. Connect Atlas Red to ChatGPT or Claude and describe the problem. It builds the map from this template in your workspace. You still check each cause against the facts.
Fishbone diagram or 5 whys — which comes first?
Start with the fishbone when you don't know where to look. It spreads the search across six groups. Then run a 5 whys on the two or three causes that hold up. The fishbone is wide; the 5 whys goes deep.