Free ecomap template
An ecomap template
you can redraw in minutes.
Put the family at the centre. Add each person, service and group around it. Mark every tie strong, moderate, weak or stressful.
Use it free — no card, no trial →
- Free forever — not a trial
- Up to 10 maps, kept for good
- Every export included
Free has no end date — upgrade only if you outgrow 10 maps. Opens with the family at the centre and seven branches around it, from relatives and friends to services.
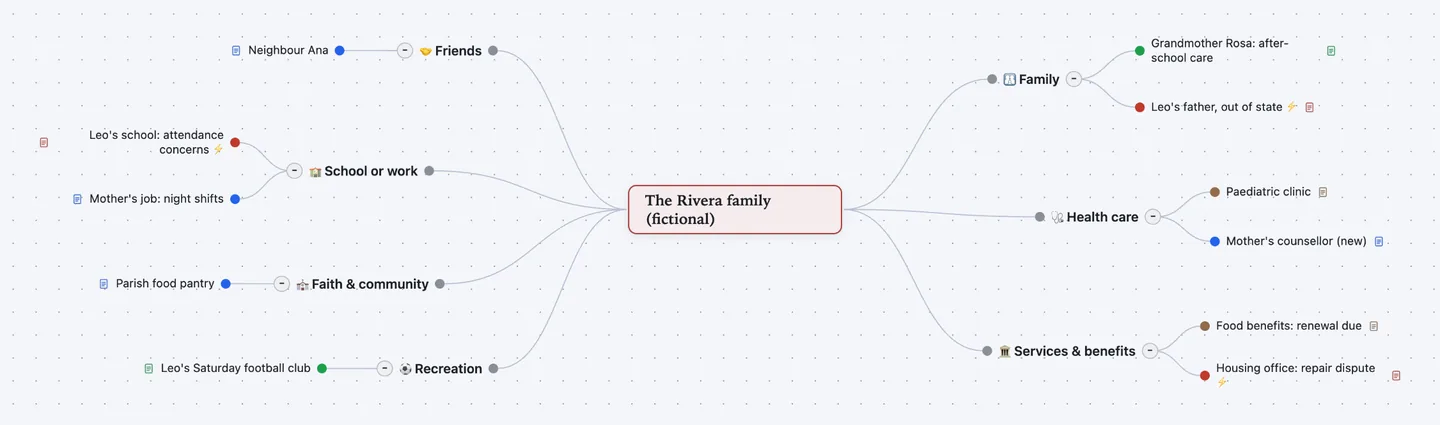
The family at the centre. Seven starter branches cover the usual systems. Add or remove one in a click; the map stays round.
Every tie has a type. Mark each connection strong, moderate, weak or stressful, and which way the energy flows. The map colours itself by it.
Update it, don't redraw it. Change a tie after a visit and the map is current. Export it as a PDF or an image for the case file.
How to draw an ecomap, step by step
Ann Hartman created the ecomap in 1975 for child welfare workers. It shows a family inside its world: the people, groups and services around it. Each tie is drawn by type — strong, weak or stressful — with arrows for the flow of energy. Social workers and family therapists use it in assessment.
- Put the family at the centre. Write the household as the map's title. Keep identifying detail out: a first name or a case code is enough.
- Draw the systems around it. Extended family, friends, school or work, health care, faith, services, recreation. Ask the family which ones matter to them.
- Add each person or service. Under each system, add the specific tie: "Grandmother Rosa", "Leo's school". One topic per tie.
- Mark the type of each tie. Strong, moderate, weak or stressful. Ask the family how it feels to them. Note what you saw as well.
- Mark the energy flow. Does the tie give support, take energy, or both? This shows where the family gets help and where it is drained.
- Use it to plan, then update it. Gaps and stressful ties point to the work. Revisit the map with the family at review and change what has moved.
Worked example: a fictional family
The Rivera family is invented for this page. A mother works night shifts and raises her son, Leo, 9. The school has raised attendance concerns. This is the map shown above.
- 👪 Family
- Grandmother Rosa: after-school careConnection: Strong · Energy flow: Gives support · Contact: Lives two streets away · How often: Daily
- Leo's father, out of stateConnection: Stressful · Energy flow: Takes energy · How often: Monthly calls
- 🤝 Friends
- Neighbour AnaConnection: Moderate · Energy flow: Both ways · How often: Weekly
- 🏫 School or work
- Leo's school: attendance concernsConnection: Stressful · Energy flow: Takes energy · Contact: School counsellor
- Mother's job: night shiftsConnection: Moderate · Energy flow: Both ways · How often: 4 nights a week
- 🩺 Health care
- Paediatric clinicConnection: Weak · How often: Missed last two visits
- Mother's counsellor (new)Connection: Moderate · Energy flow: Gives support · How often: Every two weeks
- ⛪ Faith & community
- Parish food pantryConnection: Moderate · Energy flow: Gives support · How often: Monthly
- 🏛️ Services & benefits
- Food benefits: renewal dueConnection: Weak · Energy flow: Gives support
- Housing office: repair disputeConnection: Stressful · Energy flow: Takes energy
- ⚽ Recreation
- Leo's Saturday football clubConnection: Strong · Energy flow: Gives support · How often: Weekly
Read the map for its pattern. Rosa and the football club hold the family up. The school, the father and the housing office drain it. A weak tie like the clinic is a gap a plan can close.
Let ChatGPT or Claude draft it
Connect Atlas Red to ChatGPT or Claude once. It is free. Then ask:
Make an ecomap in Atlas Red for this household: [household by first name or case code only, and the people, services and groups around it]. Use the ecomap template, mark each tie strong, moderate, weak or stressful, and say which way the energy flows.
You get the same template, filled in, in your own account. Fix what it got wrong by hand. Or ask for another round.
Questions people ask
What is an ecomap in social work?
A diagram of a person or family and the world around them. The family sits at the centre. Around it are relatives, friends, school, work, health care, faith groups and services. Each tie is marked strong, weak or stressful, with the direction of energy. Ann Hartman created it in 1975.
Ecomap vs genogram — what is the difference?
A genogram shows the family itself across generations: who is related to whom, marriages, deaths, patterns. An ecomap shows the family's ties to the outside world now. Many assessments use both: the genogram for history, the ecomap for current support and stress.
How do I show strong, weak and stressful ties?
On paper, a solid line is strong, a dashed line is weak, and a hatched line is stressful. Arrows show which way energy flows. In this template each tie has a Connection field and an Energy flow field. The map colours each tie by type.
Is this ecomap template free?
Yes. It is part of Atlas Red's Free edition: up to 10 maps, kept with no end date, every export included, no credit card. Pro is a one-time $99 payment for unlimited maps.
Is it safe to keep a client's ecomap in Atlas Red?
An ecomap holds sensitive client information. Your maps stay in your own account. Nobody else sees one unless you create a share link. Keep identifying detail out: a first name or case code is enough. Follow your agency's rules on where case records may be stored.
Can I export the ecomap to Word for a case file?
There is no Word or PowerPoint export. Every edition exports PDF, PNG, JPEG and SVG images, slides, an interactive web page, Markdown, OPML and plain text. A PDF or PNG drops into a case file. Markdown keeps your fields as "Label: value" lines and pastes into Word or Google Docs.