Free driver diagram template
A driver diagram template
from aim to change idea.
Put your aim in the centre. Branch out to what drives it, then to the change ideas you will test, each with its PDSA status.
Use it free — no card, no trial →
- Free forever — not a trial
- Up to 10 maps, kept for good
- Every export included
Free has no end date — upgrade only if you outgrow 10 maps. Opens with three primary drivers, a change idea under each, and outcome, process and balancing measures.
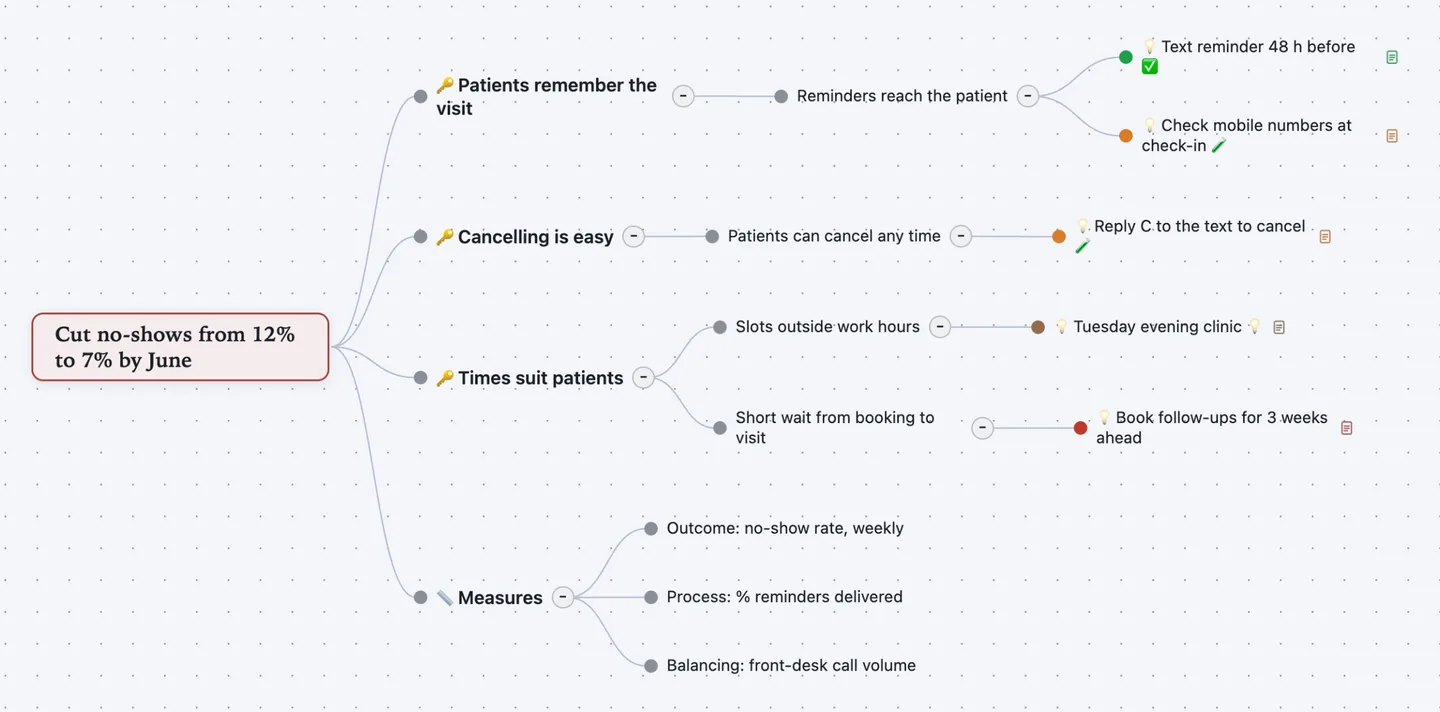
Aim, drivers, ideas. The map reads left to right, the way a driver diagram should.
Track every test. Each change idea has an owner, a measure and a PDSA status: idea, testing, adopted or abandoned.
Measures in view. Outcome, process and balancing measures sit on the same map. Export it as a PDF or slides for the team huddle.
How to build a driver diagram, step by step
A driver diagram is a tool from healthcare quality improvement. The Institute for Healthcare Improvement (IHI) and the NHS teach it with the Model for Improvement. It shows your theory: what you must change to reach the aim, and what you will test first.
- Write the aim. Say how much, by when, for whom. "Cut no-shows from 12% to 7% by June", not "fewer no-shows". It is the map's centre.
- Name the primary drivers. These are the few big factors that move the aim. Three to five is usual. Each becomes a branch.
- Break them into secondary drivers. Ask what affects each primary driver. Secondary drivers are smaller and closer to daily work. Add them as child topics.
- List change ideas. Under each secondary driver, write concrete changes you could try. Each one should be small enough to test next week.
- Test with PDSA cycles. Plan a small test, do it, study the result, act on it. Mark each idea testing, adopted or abandoned.
- Choose your measures. One outcome measure for the aim. Process measures for the changes. A balancing measure to catch harm elsewhere.
Worked example: clinic no-shows
A family practice loses too many appointments to no-shows. The team maps what drives attendance, then tests small changes. This is the map shown above.
- 🔑 Patients remember the visit
- Reminders reach the patient
- 💡 Text reminder 48 h beforeOwner: Maria · PDSA status: Adopted · Measure: % texts delivered
- 💡 Check mobile numbers at check-inOwner: Front desk · PDSA status: Testing
- Reminders reach the patient
- 🔑 Cancelling is easy
- Patients can cancel any time
- 💡 Reply C to the text to cancelOwner: Maria · PDSA status: Testing · Measure: Cancellations by text
- Patients can cancel any time
- 🔑 Times suit patients
- Slots outside work hours
- 💡 Tuesday evening clinicOwner: Dr Okafor · PDSA status: Idea
- Short wait from booking to visit
- 💡 Book follow-ups for 3 weeks aheadPDSA status: Abandoned · Measure: No change after 4 weeks
- Slots outside work hours
- 📏 Measures
- Outcome: no-show rate, weekly
- Process: % reminders delivered
- Balancing: front-desk call volume
The abandoned idea stays on the map with its result. The balancing measure watches the front desk: more cancellations should not mean more calls.
Let ChatGPT or Claude draft it
Connect Atlas Red to ChatGPT or Claude once. It is free. Then ask:
Make a driver diagram in Atlas Red for this aim: [how much, by when, for whom]. Use the driver diagram template, give three primary drivers with secondary drivers, and suggest two change ideas under each.
You get the same template, filled in, in your own account. Fix what it got wrong by hand. Or ask for another round.
Questions people ask
What is a driver diagram?
A chart of your theory for reaching an improvement aim. It runs from the aim to primary drivers, then secondary drivers, then change ideas. Healthcare and public-sector teams use it with the Model for Improvement and PDSA cycles.
What is the difference between primary and secondary drivers?
Primary drivers are the few big factors that move the aim. Secondary drivers are the smaller factors that move each primary driver. Change ideas are the specific actions you test against a secondary driver.
Is a key driver diagram the same thing?
Yes. "Key driver diagram" is the name common in US children's hospitals and some QI networks. It uses the same structure: aim, key (primary) drivers, secondary drivers, interventions. This driver diagram template works for both.
Is this driver diagram template free?
Yes. It is part of Atlas Red's Free edition: up to 10 maps, kept with no end date, every export included, no credit card. Pro is a one-time $99 payment for unlimited maps.
Can I export the driver diagram to Word or PowerPoint?
Not as a .docx or .pptx file. Every edition exports PDF, PNG, JPEG and SVG images, slides, an interactive web page, Markdown, OPML and plain text. Markdown keeps fields as "Label: value" lines and pastes into Word or Google Docs.
Can ChatGPT or Claude draft a driver diagram?
Yes. Connect Atlas Red to ChatGPT or Claude and give it your aim. It builds the map from this template in your workspace. Your team still decides which ideas to test.
Driver diagram vs fishbone diagram — which do I need?
A fishbone diagram looks back: why did this problem happen? A driver diagram looks forward: what must change to reach the aim? Teams often use a fishbone first, then turn its causes into drivers.